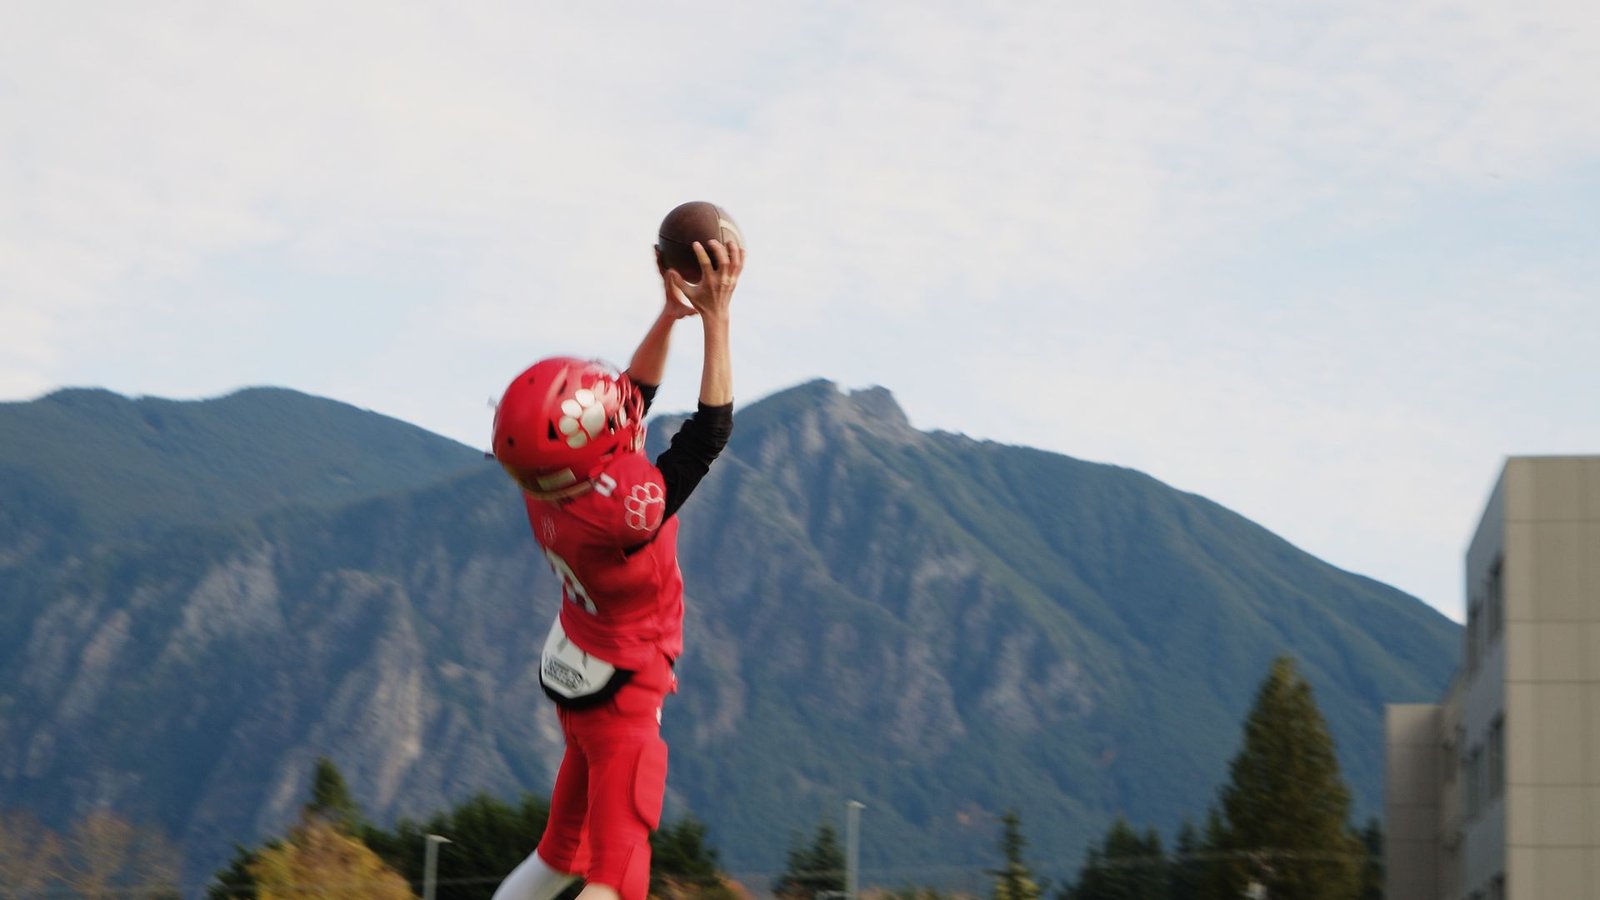
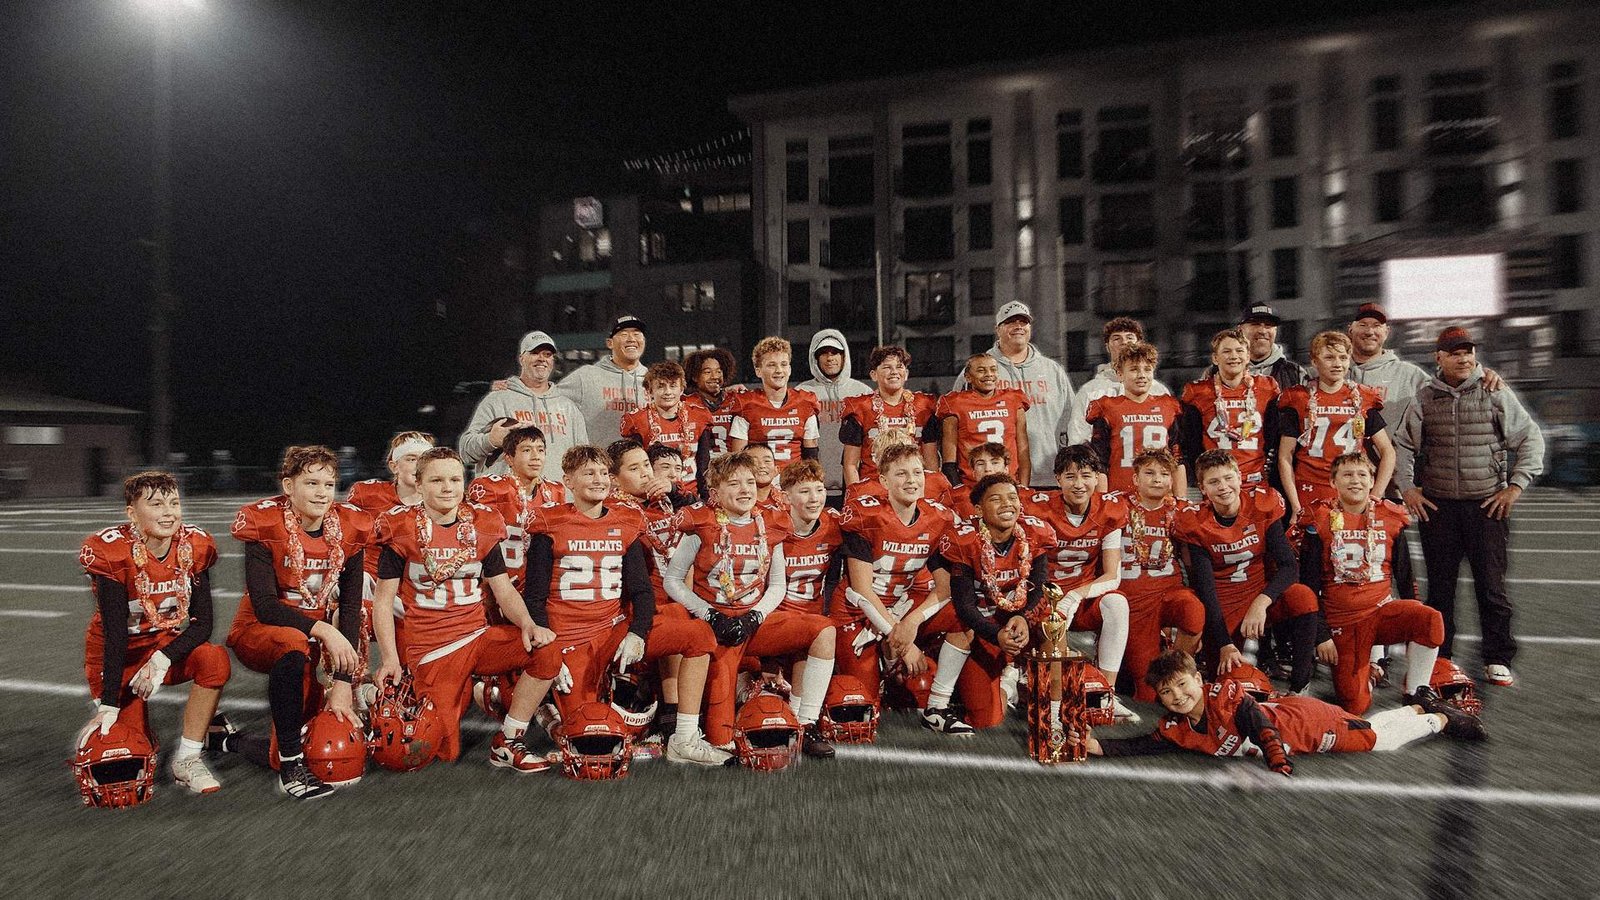
Far away in the foothills of the Cascades, the Mount Si Wildcats gather every weekend in the fall to compete for a win. This year, something was different. Talent, chemistry, coaching – everything lined up for this dominant group to lead an undefeated season (9-0). Securing the #1 seed, the team remained undefeated and won the championship confidently (34-8).
MOUNT SI WILDCATS | NORTH BEND, WA | YOUTH FOOTBALL
Our Role
Hero¹ documented the team’s full season, from sideline to sideline.
Prior to the championship, we cut (2) highlight tapes for the offense and defense to watch before the big game.
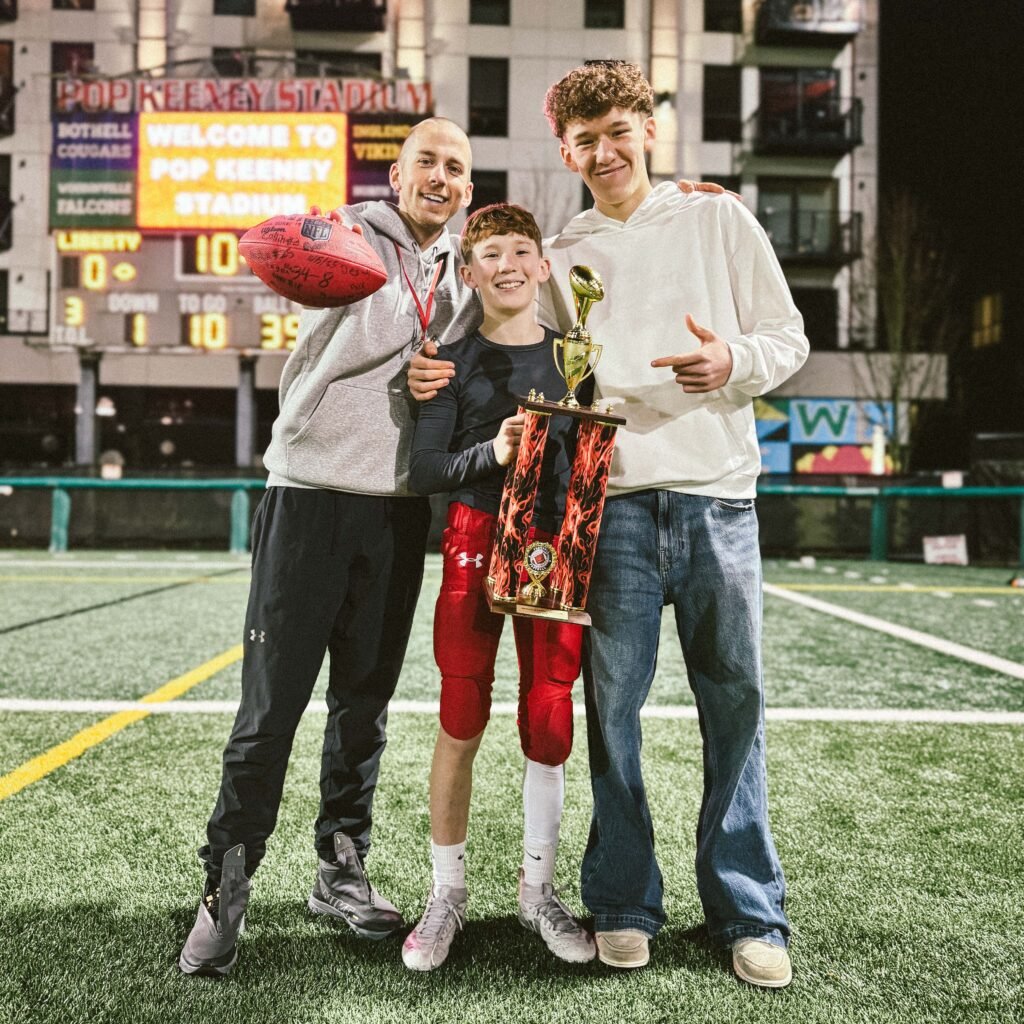
Wildcats win the championship, 34-8.
Offense
High-octane, explosive speed.
Mt. Si’s offense was heavily powered by two skilled positions, M. Godley (#9), and M. Smith (#8) – accounting for (39) of the team’s (45) total TDs scored throughout 10 games. QB L. Haigh (#2) airmailed (20) of them through the air, and hand-delivered (3) them into the endzone, himself.
Defense
Absolute dominance.
Through 10 games, the Wildcats’ D held their opponents to an average of (45) yards through the air, and (43) on the ground. They allowed (7) TDs TOTAL, and collected (24) turnovers. Additionally, (10) players on the defensive roster racked up (20+) individual tackles.
7 Total TDs Allowed That’s half of what the Seattle Seahawks allowed in 2013 (14, through 10 games).
24 Turnovers Forced Nearly matching the 2000 Baltimore Ravens, who forced 27 turnovers through 10 games.
1.9 Yards Allowed Per Rush For context, even the legendary 1985 Chicago Bears allowed roughly 3.4 yards per carry, underscoring how rare this level of run defense is.
45 Total TDs in 10 Games That’s an average of 4.5 touchdowns per game, exceeding the 2007 New England Patriots, who averaged 3.8.
6.71 Yards Per Carry In 1997, Barry Sanders averaged 6.1.
2.0 Passing TDs + 2.5 Rushing TDs Per Game The 2024 Philadelphia Eagles through 10 games, averaged 1.2 (passing) and 1.9 (rushing).
J. Cohen (#0) — 4 Interceptions, 24 Tackles, 3 Tackles for Loss In 2013, Richard Sherman recorded 8 interceptions across 16 games during Seattle’s Legion of Boom season.
M. Godley (#9) — 21 Total TDs In 2007, Randy Moss scored 16 touchdowns through 10 games with the New England Patriots.
M. Smith (#8) — 9.36 Yards Per Carry In 2012, Adrian Peterson averaged 6.0 yards per carry during his NFL MVP season.
L. Haigh (#2) — 20 Passing TDs, 4 INTs, 3 Rushing TDs In 2016, Aaron Rodgers finished the season with 40 passing touchdowns and only 7 interceptions, highlighting elite efficiency.
C. Hoerman (#3) — 68 Tackles (6.8 per Game) In 2022, Fred Warner recorded 130 tackles across 17 games, averaging 7.6 tackles per game.